How to Prepare Data for a Paper?
Data cleansing is essential if you want to prepare consistent data for your paper. Even data taken from reliable sources and experiment results may have errors and inconsistencies, so its quality should be improved. An error is any number or value that differs from the actual index received by measuring.
To cleanse the data, you need to review it, make an analysis, detect errors, and remove everything incorrect. Data cleansing may have some other names, such as data scrubbing or data cleaning. Let’s have a look at what these terms actually mean.
Why Is It Important to Cleanse Data?
When you collect data with the help of quantitative research, you utilize statistical analysis. Hypothesis testing helps you see whether the received data supports your prediction or opposes it.
Suppose you do research on a new medication able to reduce fatigue. You prepare a survey for the participants with close-ended questions using the Likert scale. They have to answer them before and after the treatment, sharing their experiences on a 1-7 scale.
When you analyze the answers, you may notice that there are some errors. They are inevitable, and you need to apply data-cleansing methods to deal with them. If you do not take any action, the results of your study and overall conclusion will be invalid or false.
In our example, the questions are formulated in a positive way, but some of them look like negative statements to engage patients.
e.g., Question: Rate from 1 to 7 the extent to which you agree or disagree with the following statements.
- Positive statement:I feel relaxed and energetic when I wake up.
- Negative statement:I don’t feel rested after 8-9 hours of sleep.
Both statements are supposed to measure the same indicator - how well a respondent feels in the morning. However, the answers to a negative statement should be coded in a reverse way. It is called reverse coding or interpreting the scale in the opposite way so that 1 in the first question means 7 in the second question. If you do not reverse these answers, you will come across a data error, and the result will be invalid.
Treating Dirty and Clean Data
Dirty datacan contain errors and inconsistencies. It can emerge at any stage of the research process. It can start from a poor research design, inadequate measurement tools, or distorted entries of data.
Clean datais high-quality, and it meets all the requirements. The other characteristics of clean data are validity, accuracy, completeness, consistency, uniqueness, and uniformity. Flawed or dirty data are invalid, inaccurate, incomplete, inconsistent, duplicated, and incorrectly formatted.
Validness of Data
Valid data meets all requirements for a certain type of information (e.g., dates, statistics, numbers, etc.). Invalid data do not meet these requirements, and the values differ from those acceptable for this kind of observation.
If you see a date of birth, you can understand it only if it is written in a certain format, such as dd-mm-yyyy. The day implies the numbers from 1 to 31, the months can be indicated from 01 to 12, and the years can end with 2022. If the number in the field exceeds the accepted value, it is not valid.
A data analysis process does not make sense if the data is invalid. You need to utilize certain data validation techniques to check the information before making an analysis.
Accuracy
Accuracy means how close the value you have received is to the true value. It is about the content of data but not its form.
Completeness of Data
Complete datarepresents all the necessary information. Incomplete data misses some points, so you cannot measure it thoroughly.
A participant intended to answer an open-ended question. However, they received a phone call, and after coming back to the survey, they started answering the next question. The previous one was left without a complete answer.
When you try to analyze such incomplete answers, you need to reconstruct their missing parts. It is not easy to do, and you may need to contact participants for completion or clarification. However, the participants may have forgotten what they meant to answer, so you won’t get the complete data, anyway.
Consistency
The data received from all participants in your sample should be logical and make sense across the entire database. It should equally relate to different variables.
Let’s have a look at the example of inconsistent data. The survey asks questions about demographic variables. The age, education level, and social status are included. Suddenly, you see that one of the respondents has written ‘15’ for the age and ‘PhD’ for the level of education. Such data cannot be consistent because it is hardly believable that a 15-year-old teenager can hold a doctorate degree. You can assume that the age was indicated by mistake.
Uniqueness
When you make an analysis, you may include the data from the same respondent twice by accident.
Let’s see an example of such duplicated data. You have conducted your survey online, and one of the participants clicked ‘enter’ twice to submit the answers. So, you got the same data twice. That is why it is very important to review all the data for duplications. If you notice identical entries, you should remove one of them or the whole set will be incorrect.
Uniformity
Uniformity means using the same units of measurement throughout the entire report. If the data is in different units, convert them to the standard measurements.
You ask your participants to indicate their gross salary in US dollars. However, some respondents answered with their monthly salary, while others indicated their annual earnings. In this case, your question should have provided a time unit to be understandable for everyone. While analyzing the data, you won’t even know what time frames different participants have used.
How to Clean the Data?
Dirty data requires cleansing. However, various datasets need different techniques. Try to make cleansing systematic. You need to collect as much data as possible, but be sure that the final dataset is clean.
Sometimes, it is rather difficult to pinpoint all the errors. You may never know whether a certain point reflects the actual value or something that has been distorted. That is why it is essential to focus on finding the data points that do not correspond to the rest of the data. They may involve missing parts, incorrect formats, irrelevant values, or outliers.
There are several techniques to cleanse data. You can choose the most appropriate ones for your goals and needs. Remember that all the final information should be consistent, uniform, valid, and unique. It should look as complete as possible.
Process of Data Cleansing
You can scan the entire data to start the process of cleansing. You will notice the issues and then correct them by using systematic, standardized procedures. This workflow may include:
- the application of data validation techniques for dirty data prevention;
- screening the dataset for inconsistencies and errors;
- diagnostics of all data entries;
- development of data mapping codes for valid values only;
- use of standardized procedures for data removal or transformation.
You cannot apply all these steps in a row to all your datasets. Use these techniques where you need them. Make all the processes transparent with clear documentation of all changes and modifications. That will allow other people to review and replicate such procedures.
Validation of Data
Data validation includes several types of constraints to ensure the consistency and validity of all information. These constraints can be applied even before you start data collection, during the development of questionnaires or measurements, which needs manual data entry.
The validation constraints can minimize the further need for data cleansing and save you a lot of time and effort. They include the following:
- Data-type constraints. Values are appropriate only if they are of the same type, for example, texts, passages, or numbers. If the data is entered as texts and numbers (10 April 1987) in one place and just numbers (10.04.1987) in other places, it cannot be valid.
- Range constraints. All the values should correspond to a clearly indicated range. For example, if your questionnaire has to cover respondents between 18 and 45 years old, all the values they can enter should range between 18 and 45.
- Mandatory constraints. There are certain fields in a questionnaire that are mandatory to fill out. For example, before filling out the form, a respondent should click the button with the sign ‘I agree.’
Screening Data
If you want to keep the collected data safe, it is worth creating a backup. In this way, you can correct mistakes if you have made them in your workflow. You may even want to start afresh if you have a reliable backup that can be duplicated. A new copy you will work with will contain the changes, while an older one will preserve all the previous information that may be useful in the future.
To make sure that your dataset does not contain mistakes, use data screening. It involves examining all the information to find if there is anything missing, inconsistent, or invalid. You can also detect outliers. The job can be performed manually or with the help of statistical methods.
Here are some steps on how to do data screening effectively.
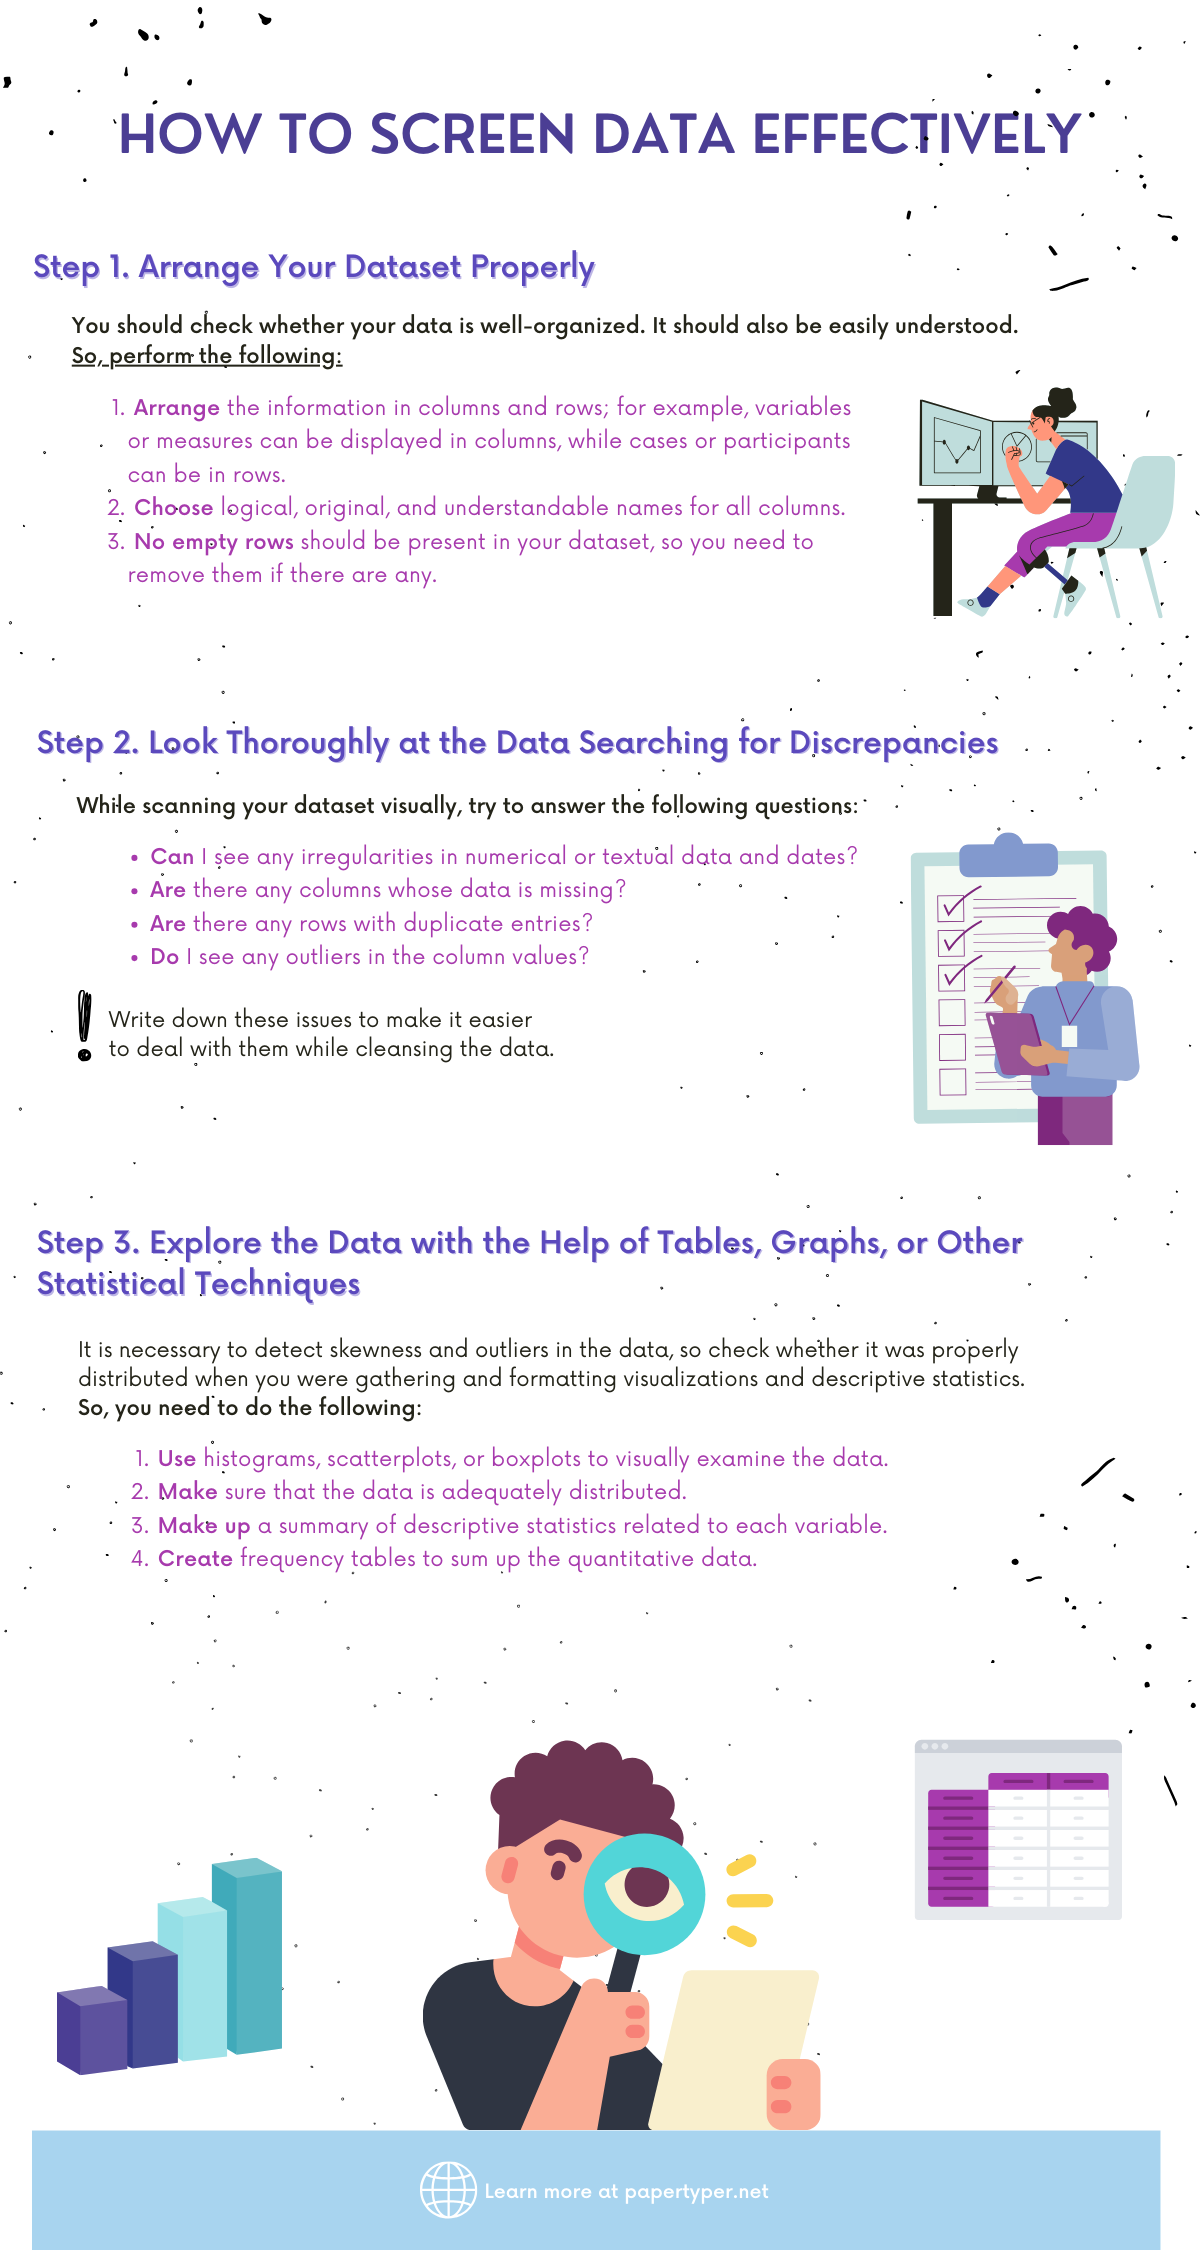
Step 1. Arrange Your Dataset Properly
You should check whether your data is well-organized. It should also be easily understood. So, perform the following:
- Arrange the information in columns and rows; for example, variables or measures can be displayed in columns, while cases or participants look more straightforward in rows.
- All columns should have logical, original, and understandable names.
- No empty rows should be present in your dataset, so you need to remove them if there are any.
Step 2. Look Thoroughly at the Data Searching for Discrepancies
While scanning your dataset visually, try to answer the following questions:
- Can I see any irregularities in numerical or textual data and dates?
- Are there any columns whose data is missing?
- Are there any rows with duplicate entries?
- Do I see any outliers in the column values?
You can even write down these issues to make it easier to deal with them while cleansing the data.
Step 3. Explore the Data with the help of Tables, Graphs, or Other Statistical Techniques
It is necessary to detect skewness and outliers in the data, so check whether it was properly distributed when you were gathering and formatting visualizations and descriptive statistics. So, you need to do the following:
- Use histograms, scatterplots, or boxplots to visually examine the data.
- Make sure that the data is adequately distributed.
- Make up a summary of descriptive statistics related to each variable.
- Create frequency tables to sum up the quantitative data.
When you have a look at all the quantitative data for variables, you can see how well it is distributed, so the visual impression can be rough and inaccurate. That is why you need scatterplots and boxplots to be more exact and possibly detect any extreme values. Proper variables distribution is very important if you want to pick out the most applicable statistical test within the research.
It is easy to detect outliers if you notice that the mode, median, and mean diverge from each other a lot.
Final Thoughts
You have some useful tips on how to cleanse the data in your dataset. This procedure is important because dirty data can distort the results of your research and make them biased and inconsistent. As a result, you won’t look persuasive and trustworthy if other researchers decide to test your conclusions. Or you may receive information at the end of your experiment that will be far from the expected results, and all your research will become invalid.
That is why you may see the importance of data cleansing for making your research and its conclusions more consistent and reliable.