Explanatory and Response Variables in Research Methodology
When it comes to research and statistics, a lot of confusion comes to play. Students are frequently thrilled to conduct a survey in a fast and simple way, but the absence of knowledge and understanding of the fundamental analysis principles distract them from this objective significantly. They spend more time on finding the right tools rather than proceeding with their investigation.
It is high time to break this evil circle and discover what is the right approach to collecting and analyzing data. If you do not know what to start with, just try to question what phenomenon you would like to check in practice. For that purpose, so-called explanatory and response variables will come in handy.
Long Story Short: What Is What?
Putting complicated terms aside, let’s find out what explanatory and response variables signify in practice.
Consider that you are running a survey. Do individuals hand out a bigger number of sweets and candies on Halloween to trick-or-treaters who wear spooky or humorous outfit settings? It is time to check.
- Together with your friend, you decide to experiment. You begin with creating the required costumes and styling monster and SpongeBob gowns. After you dress up, your journey is ahead. You meet up after the event is over and calculate how many sweet achievements you collected during the evening. It turns out that the theory is favorable to a funny costume — your friend collected way more candies than you. You promise to dress up as a more positive character next year and see who is going to win this time. You find that your basket with candies is heavier and happier. What is the moral of the story?
- The total amount of sweets in this experiment can be called scientific as well. It is a bright sample of the response variable, as it is known in statistics. This parameter is defined and altered by researchers. In the analyzed scenario, the value of gathered treats performs the function of the aforementioned variable.
- Numerous related aspects of the research are usually referred to as explanatory ones, and the latter might have an impact on the response characteristics.
- Dependent variable is correlative with response versions. Both of them are predetermined or caused by the independent variable, which is the original question friends did ask about the more successful costume for Halloween.
Keywords to Distinguish
A variable acts as a research parameter that can either be altered or cause fellow changes or both. If you want to experimental study to be successful, you have to be aware of how interconnected different variables are within the same analysis and under selected conditions. Only then will you be able to state that the achieved result is accurate.
There are several distinct kinds of these changing parameters. Finding such causal links between involved aspects is a real goal of any experiment. The most common characteristics of the research can be briefly defined as follows:
- Independent — it is not altered by in-experiment phenomena. You try to measure how this single (or not) parameter influences other variables. he independent research aspect is picked up by students.
You would like to check how fast eighteen-year-old students can write an essay on an unknown topic with or without the assistance of online academic paper writing services. Age, as here, and time are the most common samples.
- Dependent — this variable is the core phenomenon to measure during the experiment.
Let’s assume that you need to define how your grades change after you start working with online do my homework services. You check the obtained grades, and it is a dependent variable here. When you desire to see how alcoholic and non-alcoholic beverage consumption influences your behavior, the latter will be dependent.
| Independent Variable | ➡️ | Dependent Variable |
|---|---|---|
| Researchers consider the value of a particular aspect… | …To observe, analyze, and record one of the prospective consequences of this phenomenon. |
- Explanatory — the essence of this figure is close to what its name implies. It explains why the following events or changes take place. It can be influenced by other variables naturally or by scientists if required.
You have to define how different academic levels (in school, third vs. fourth graders) influence the students’ height and who is taller among them. A grade level is a condition that explains why children are smaller in this or that class.
- Response — it is also known as an outcome variable, which describes a result framed by the explanatory variable. After the manipulation is experienced, it alters accordingly, and these changes can be observed and measured.
Let’s consider a slightly reversed sample from the previous explanation. When scholars take a random number of students at the school to check whether there is a correlation between their height and age. So the first parameter acts as an explanatory variable, while the second one is a response one.
| Explanatory Variable | ➡️ | Response Variable |
|---|---|---|
| Scholars alter the value of this parameter… | …To observe and measure/analyze the effect it has on the distinguished parameter. |
Response vs. Dependent Variables
You have the following puzzle — a response variable = or ≠ a dependent variable. How are you going to answer it now? The difference between these notions is subtle yet crucial. The answer is not as straightforward here as in the equation below. Although different terms are applied, they commonly apply to the same notions in the research. What explains the necessity for two separate terms is the peculiar nature of the main variable they are attached to — since they do not coincide in their properties to the full, response and dependent variables do not as well.
Explanatory vs. Independent Variables
The next puzzle to solve is as follows: an explanatory variable = or ≠ an independent variable. The difference between these notions is subtle yet crucial. According to research theory, data points are solely controlled or changed by scholars and are not expected to be influenced by other variables. Caffeine dose is an independent variable. For instance, if students conduct a controlled study in which they are enabled to precisely determine the amount of the substance each participant gets.
However, since such aspects might alter under the impact of fellow variables (as it usually happens in the real world — there are just a few inert gases), the related notion has become occasionally favored. Therefore, the majority of studies are conducted with explanatory variables. Independent ones might not be fairly "non-connected."
Samples of Explanatory and Response Variables
There are several scenarios where the analysis of explanatory and response variables is valid. Just check them out!
| Does a healthy vegetarian diet help in gaining muscle strength? The goal of the experiment will be to define whether the intake of vegan-friendly and meat-free products will have any positive impact on your weight and body composition. |
| You would like to define how free or prepaid online academic paper writing services influence your progress in your studies. In this case, your results, such as grades, will be identified and measured (as a response variable) based on the use of modern simplification tools for free or for real money (in the role of an explanatory variable). |
How to Display Your Research Results
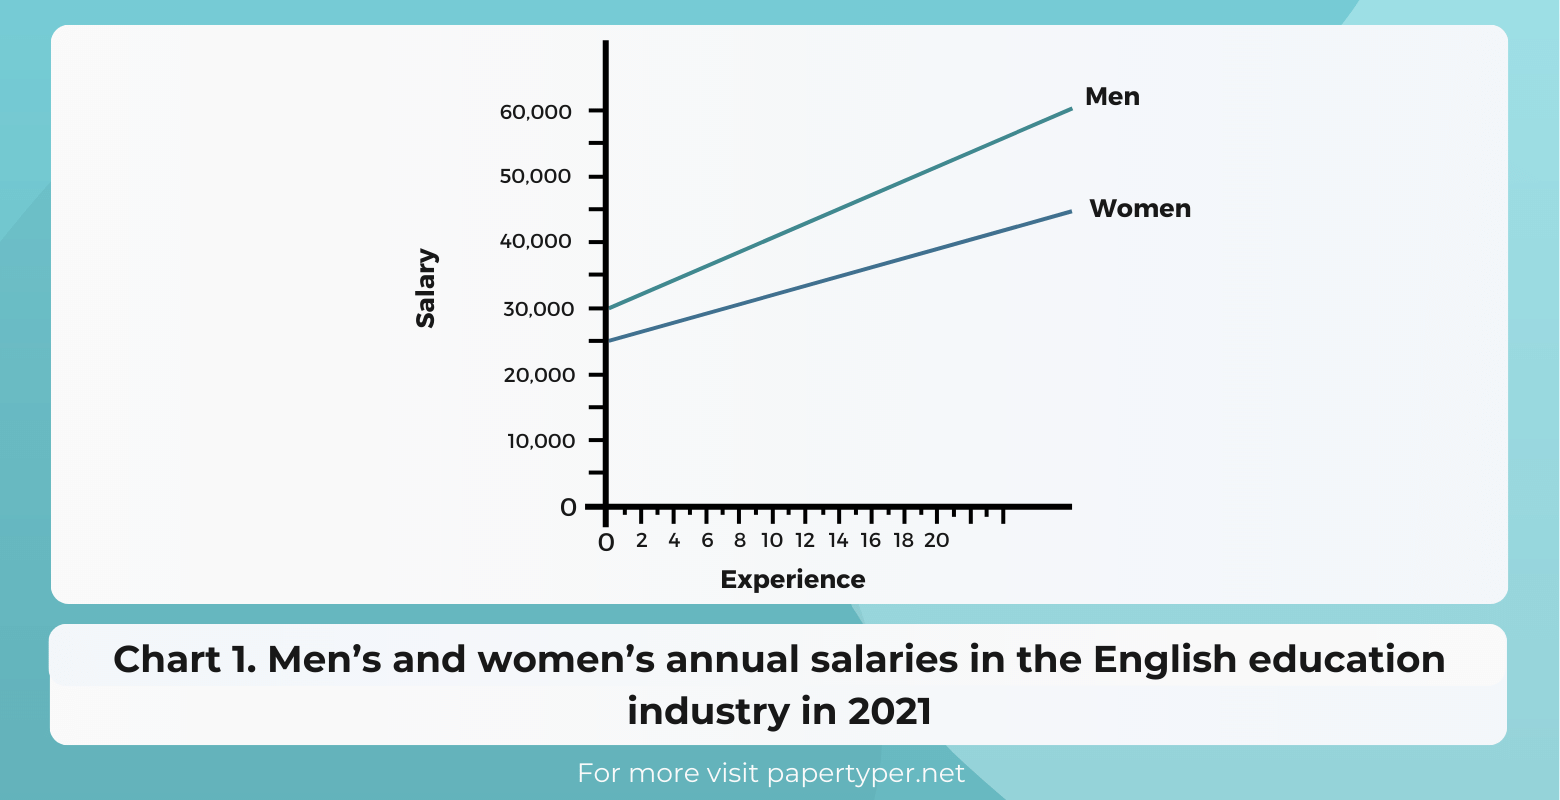
If your analysis has both variables under consideration, you can clearly depict them on the same graph or chart. The way explanatory vs. independent and response vs. dependent variables are shown coincides. The first category of notions in the formula refers to the x-axis (a horizontal one), while the y-axis (a vertical one) belongs to the other section of phenomena.
The way you depict your studies’ results can vary. Students commonly prefer minimalist lines and views, which can be seen in academic papers (as shown in Chart 1). The data is not accurate here, so you can accept it for illustrative purposes only.
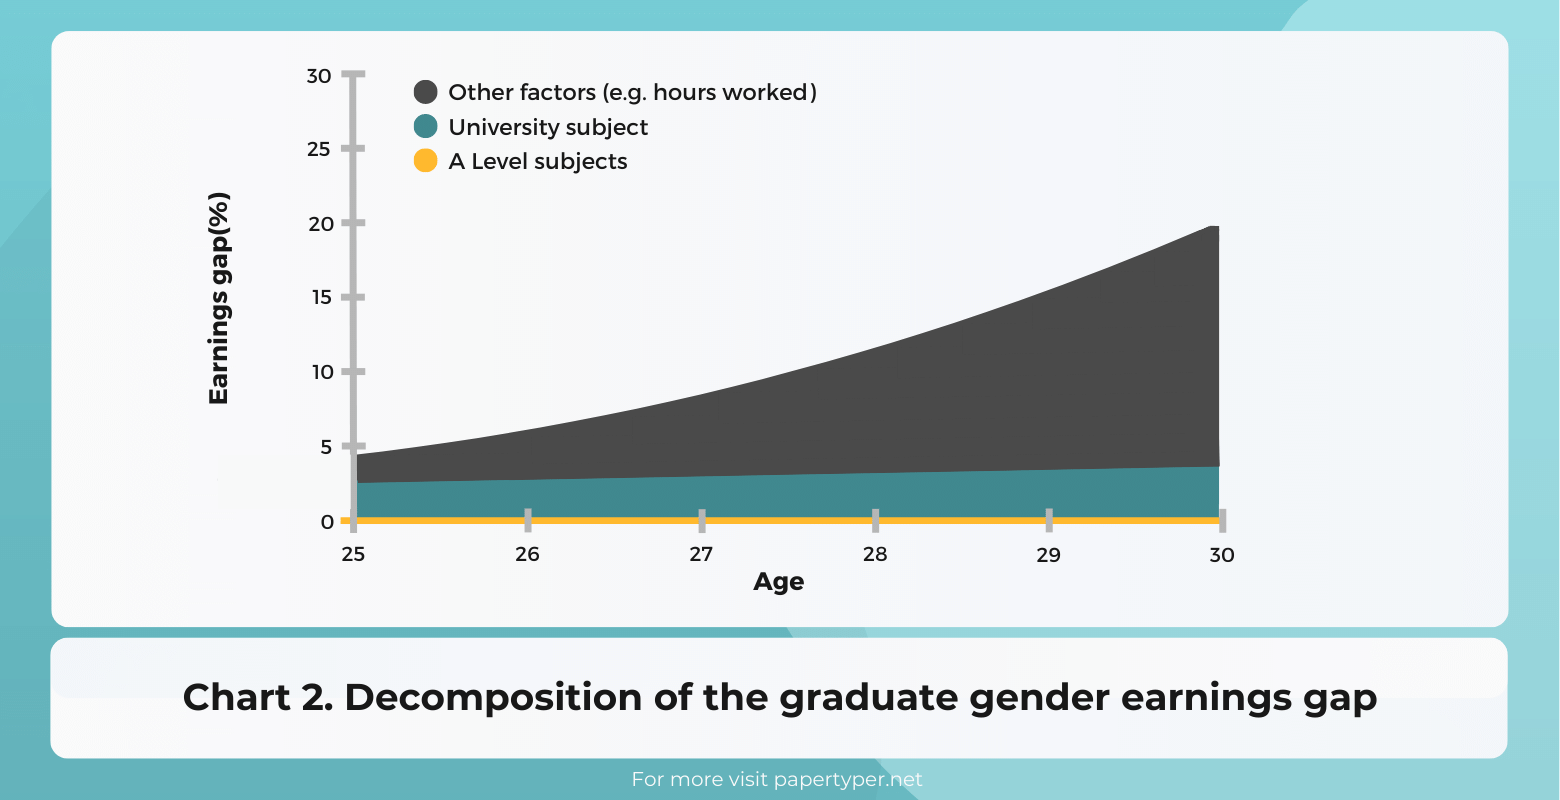
When your figure is meant to include a lot of parameters and characteristics, it is better to diversify a chosen template and make it more eye-catching. This will let viewers perceive the provided data smoother and simpler (as displayed in Chart 2).
Judging such graphs and charts, students can make a conclusion on how qualitative the results are. To succeed, you have to pay attention to the quality of variables. The aspects below will help you in this research area:
- Stability — if fundamental aspects of the research remain the same during repeated experiments, other variables should show alike and identical results. If drastic differences occur, there are two potential explanations — either the variable is chosen/measured incorrectly, or there are variables that are not defined yet to influence the final outcome.
For example, your task can be how a clear room or environmental chaos influences the owner’s concentration. After the initial outcome is analyzed, do not hesitate to add more response variables like the personality’s anxiety or creativity for participants from different age and gender groups.
- Complexity — your research conditions influence a lot and predetermine how many variables are better to analyze at once. To get it done neatly, specialists suggest novice users and students experiment with a few basic parameters. It is necessary to understand their difference. Once their unique traits are understandable intuitively, it is high time to make the study more complex.
- Operationalism — if the connection between variables is broken, the choice in favor of these or those variables is wrong. The influence of an explanatory (or an independent) parameter is given. If there are aspects that do not depend on it, they are better to be excluded from your current research. The measurements to do might be unobvious. How do people define their anxiety or burnout level? You can refer to professionally established ratings and systems or minimalist scales from zero to ten, where the smaller the number, the less dominant the emotion/experienced phenomenon is.
Final Thoughts
Your studies do not have to be dull or daunting. Understanding the key statistics and research principles will help you conduct such projects faster and in a non-nerve-wrecking manner. The ability to ask the right questions and find answers to them is influenced by your attention to detail.