What Is Data Cleansing
No matter how thoroughly you are planning your research design, errors may occur. Data cleansing is meant to correct such errors that refer to any values (e.g., recorded height, weight, length, etc.) that do not correspond to true values (e.g., actual height, weight, length, etc.). If recorded improperly, such values can potentially lead to data inconsistencies. Such data are considered “dirty,” so the aim of data cleansing (cleaning or scrubbing) is to make the entire dataset “clean” and, accordingly, reliable.
To cleanse the obtained data, you will need to review all the results, analyze them, detect possible errors, and either modify or remove them from the dataset.
Importance of Data Cleansing
Your research question requires accurate and consistent answers received through statistical analysis in quantitative research. If you need to test the hypothesis, your data have to support or reject it. If the data is not calibrated properly, you can receive biased outcomes related to the information or omitted variables.
You want to do quantitative research on the influence of coffee on office workers’ productivity.
You create a survey to test the participants’ work efficiency before and after coffee uptake. You have used closed-ended questions and a Likert scale to observe the respondents’ experiences, making it 1-7 points.
You have to be prepared for errors here because, in many cases, they are inevitable. Therefore, you need cleansing to minimize their effect on the overall results. If you do not correct the errors or remove the invalid data, you will come to a false or misleading study conclusion.
Let’s come back to our example. Your questions are mostly asked positively. Though, we suddenly spot the question with negative frames. Such questions are interesting for participants, but a researcher needs to be attentive to them.
The question is - “Please evaluate how much you agree or disagree with the statements by giving them points from 1 to 7.”
- The positive frame is “I feel refreshed after I take a cup of coffee after 3 hours of work in the office.”
- The negative frame is “I do not feel energetic after a cup of coffee taken in three hours after I start my work in the office.”
Both questions are related to the same situation - how well respondents feel after a cup of coffee in the middle of their work routines. Though the second question is negatively worded, and you need to reverse-code it before the analysis to make the answers express the same direction of respondents’ feelings.
Reverse coding is about evaluating the number scale in an opposite direction so that the minimal extreme value in the answers to positive questions corresponds to the maximum extreme value in the answers to the negative questions. If you do not do that, you will get an error in the data, and your conclusion will be invalid.
When you use such inaccurate data in your analysis, you will face a Type I or II error in the conclusion that may significantly influence the overall outcomes of the research. The consequences may be dramatic, especially if you are doing this research to involve investments or discover new opportunities.
If you get a Type I error, you may conclude that coffee is not effective when it actually is. The organization you are doing the research for can decide to reduce the coffee intake in its office workers, and their productivity will go down over time resulting in less efficient workflow in the entire organization and its possible failure to withstand the competition on the market.
Dirty and Clean Data Produce Different Outcomes
Dirty data can appear at any stage of the research process. They may contain inconsistencies or mere errors. The incomplete research design, inappropriate measurement tools, and materials, mistaken data entry, etc., may add a lot to the appearance of dirty data.
Clean data is of high quality because it meets all the requirements, and it is a positive result of your elaborated research design and proper measurements.
Therefore, dirty data is invalid, inaccurate, incomplete, inconsistent, duplicate, and incorrectly formatted, while clean data is valid, accurate, complete, consistent, unique, and uniform.
What Is Valid Data?
Valid data meet all the requirements commonly accepted for certain types of information, such as dates, texts, and number formats. Invalid data cannot meet these requirements. That is why you need to consider data validation every time you have doubts about whether your data is valid or not.
You may need to check the date of birth format because it should be formatted in a specific way - dd-mm-yyyy. You can see that the date has to include two figures; the month is the same, while the year should have four figures in it. If you encounter numbers with different values, your data is not valid, and further analysis will be a failure. So, use data validation techniques before you start your analysis.
Why Does Accurate Data Matter?
You need to be accurate with measurements. Your results should be as close to the true values as possible. Data accuracy is about real-time content.
You ask the question, “How often do you change your bed sheets?” The possible answers are “every week,” “biweekly,” “once a month,” and “less than once a month.” However, the word “biweekly” can mean either “once in two weeks” or “twice a week”, and these are different frequencies.
Though some respondents choose “biweekly” if they change their bed sheets twice a week because they interpret the word in this way, so your data cannot be accurate.
When Is Data Complete?
When we speak about the complete data, it means that it is measured and recorded with all the necessary details. Incomplete data can miss some information. For example, this data is incomplete. Suppose you conduct an online survey, and one of the participants has started to write a response to an open-ended question. Then, there was some distraction, and after returning to the survey, they immediately moved to the next question, leaving the previous one incomplete.
You can attempt to reconstruct the missing data, but it is not easy, especially when it deals with open-ended questions. You may need to contact a participant to make an inquiry or ask them to complete the survey again. Sometimes, it may be technically impossible, or you may not get the complete answer anyway.
When Is Data Consistent?
The entire dataset should make logical sense and be consistent when referring to all members of the sample and to different variables.
Let’s look at the inconsistent data. In one survey, collecting data about age, marital status, and other demographic variables, one of the participants indicated that he is 12 years old, married, and with two children. This information cannot be consistent because a 12-year-old boy cannot be married and have two kids. Obviously, the respondent made a mistake while entering his age.
What Does Unique Data Mean?
You may record the data from the same respondent twice, so it is duplicate but not unique.
An example of a duplicate entry is the following. You have conducted a survey online, and one of the participants pressed “Enter” twice while submitting the answers. So, you have also reported this data twice. Therefore, before the start of the analysis, look through all the data to detect identical entries and remove all duplicates. If you do not do that, the data and the analysis results will be distorted.
When Is Data Uniform?
All the data you collect has to be obtained with the same measurement units. If the units are different, the data cannot be uniform, and the results need to be converted to the standard measuring system.
When you asked your participants to indicate their expenses on food in US dollars, some participants responded about their expenses per week, while others indicated their expenses per month. You have not provided the time unit here, so the question was interpreted in different ways. You can see that the results are too different to be valid, but you will never know what time frames each participant has used.
How Can You Clean Data?
Cleansing data requires different techniques related to the specific characteristics of the dataset. However, the process has to be systematic. Even if you want to get as much data as possible, it should be clean.
Data cleansing may be a time-consuming and challenging process because you may have collected a lot of data, and detecting errors in them at once is rather difficult. You may not even know whether the data is accurate and reflects the true values.
Therefore, you should concentrate on looking for data that does not correspond to all other values. It is more obvious because some values may be missing, incorrectly formatted, irrelevant, or contain outliers.
There are various techniques for data cleansing, and you should choose the most appropriate one. You need to receive consistent, valid, unique, and uniform data at the end, no matter what method you apply.
The Process of Data Cleansing Step-by-Step
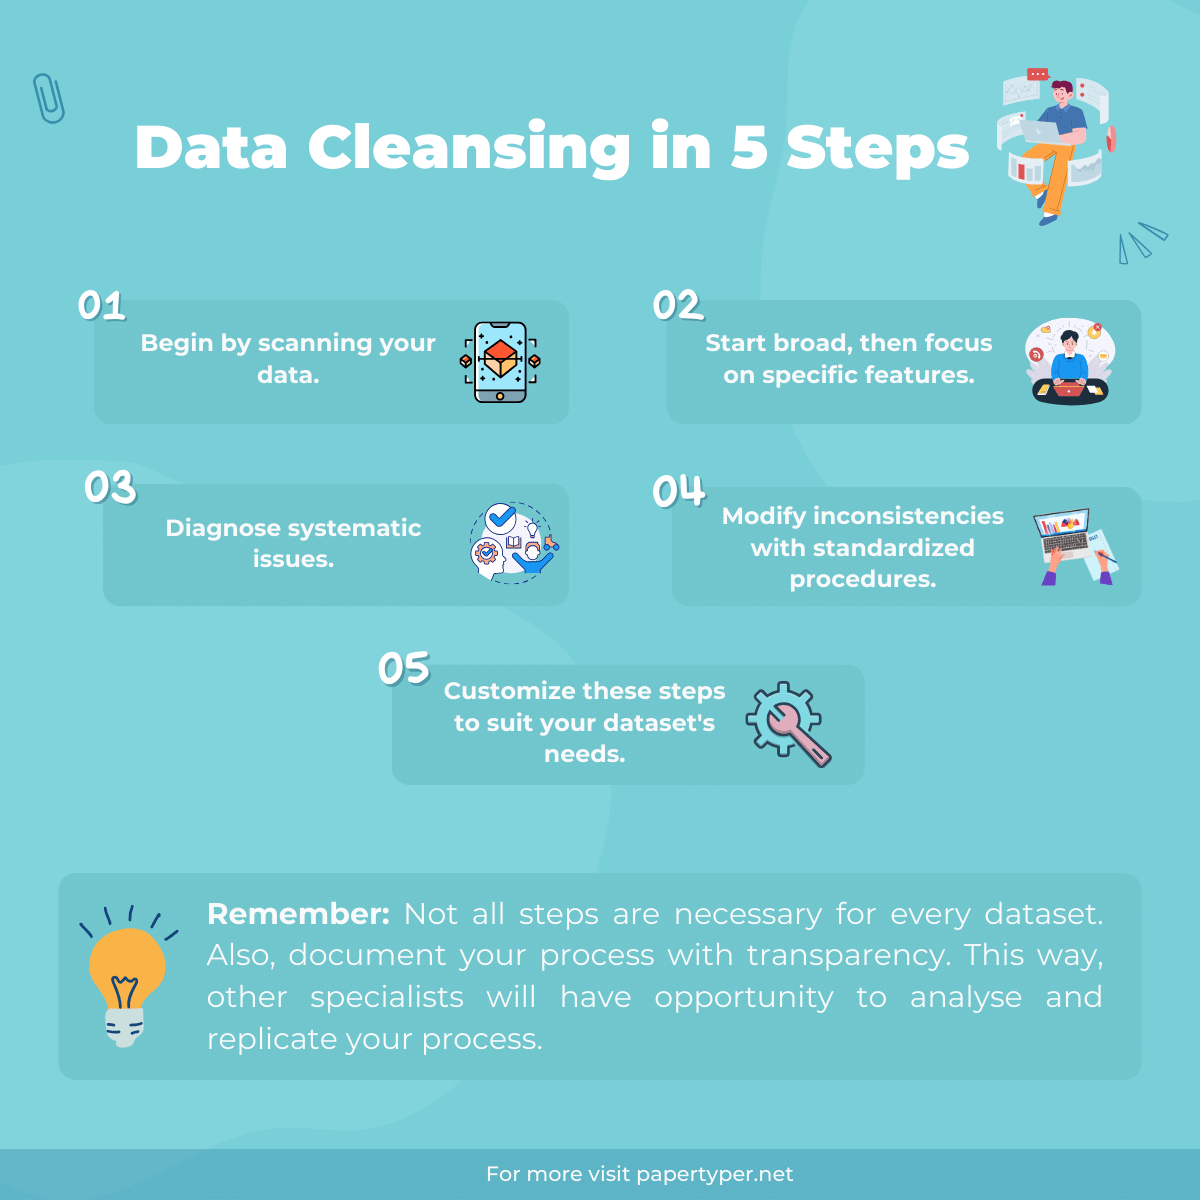
You need to begin the data cleansing process by scanning all the obtained data. You can start at a broader level and then arrive at the specific features. Try to diagnose the systematic issues first and then continue with modifying individual points with the help of standardized procedures. The step-by-step workflow can be the following:
- Step 1. Use data validation to avoid dirty data entries.
- Step 2. Screening the dataset for inconsistencies and errors.
- Step 3. Look through all data entries to diagnose specific inconsistencies.
- Step 4. Make up a coding system for turning the data into valid entries.
- Step 5. Use standardized procedures to transform or remove inconsistent data.
You do not need to use all these steps for every dataset. Apply them where they are needed. Do not forget to document the cleansing process clearly for further transparency. It is important when other people are involved. Or other researchers may want to review or replicate the procedures used by you.
Validation of Data
Apply limitations and constraints to ensure that all the data is consistent and valid. The procedure can be used even before you start collecting data. For example, you may consider it while compiling questionnaires or other measuring materials manually. Such measurements will also require entering all data by hand.
When you use different constraints, you will minimize the time for data cleansing in the future. They can be data type, range, and mandatory constraints.
Data-type constraints mean that all the values are accepted only if they are of the same type, for instance, texts or numbers. For example, if the data is in both types, like in “the 2nd of April 2019,” it is not accepted because the format should be “02-04-2019.”
With range constraints, all data should locate within a specific range. For example, your questionnaire is for the target population aged 25-40. Participants will have to enter their age in figures from 25 to 40 to continue the form completion.
The constraints can also be mandatory. It means that every value should be entered and confirmed by pressing the button “I consent” or like that.
Screening the Data
When you complete data collection, create a backup and store it safely in a specific place to be on the safe side. You may also make some mistakes in your work, so it will give you a chance to start anew. You will only duplicate the backup and continue your workflow with a new copy.
Now, you can review your obtained dataset for outliers, inconsistent, missing, or invalid data. You can use certain statistical methods or do it manually.
You need to follow the specific procedure here:
- Dataset has to be straightened up. That will help you store your data well-organized and understandable. You need to make columns for every variable and rows for every case or participant. Name your columns and rows logically. If you spot any empty rows, remove them.
- Scanning the data for potential discrepancies to answer the questions:
- Do these irregularities refer to dates, numbers, or textual data?
- Is there any missing data in the columns?
- Do any rows contain duplicate data?
- Do some values in the columns look like extreme outliers?
You will need to take notes of these issues in every specific case and decide what to do with them within the cleansing procedure.
- Exploration of the data with the help of statistical techniques or tables and graphs will help you identify how the data is distributed and whether it features any skewness or outliers. Descriptive statistics and visualization will help you with the following:
- exploring the data visually with histograms, boxplots, or scatterplots;
- checking the correct distribution of all the data;
- creating the descriptive or summing-up statistics for every variable;
- summarizing all the quantitative data with the help of frequency tables.
You need visualization to obtain a rough summary of how your quantitative data is distributed. The distribution is also easy to see in boxplots and scatterplots. No extreme values will ever fit them. You can also use corresponding statistical tests to check the distribution. If the mean, median, and mode are completely different, there may be some outliers in the analyzed dataset, and you need to spot them.
Diagnosing of Data
After you complete an overall review, continue with more specific analysis and diagnostics. Develop a standardized procedure to detect various types of data and process them. You need proper planning, too, not to skip any data points that need cleaning. If not considered, they will result in a biased dataset and outcomes.
The most common problems you may encounter in the dataset are duplicate, invalid, missing data, and outliers.
You will have to re-duplicate the data, which implies detecting and removing identical copies. You will have to leave only unique data cases or participants’ answers. For example, you have made a spreadsheet with columns for questions and rows for the participants. Each column should contain the data obtained from one participant. Now, you spread the data by columns and review it row by row. If you detect identical rows, you need to remove them. If you leave such duplicated rows, they will bias the entire results.
When dealing with invalid data, use data standardization. You have to make all the data uniform by identifying and converting different formats. You can apply this technique after you have collected all the data. However, you need to develop codes beforehand. Standardization of data is applicable when you do not have any constraints at the data entry stage or if you encounter data in inconsistent formats. For example, you have used an open-ended question in your survey related to the participant’s age, and you detect that the data is a mix of words and numbers, with some mistakes in spelling, like “24,” “twenty five,” “ninteen,” “20”, etc.
You can use string-matching methods to standardize the inconsistent entries. They can be strict or fuzzy, and they help to identify exact or approximate matches between the valid values and obtained data. A string is a sequence, and here it is a sequence of specific characters. You can compare the data strings with valid values and remove or replace those that do not correspond to the format. If the string-matching is strict, you have to consider all the strings that do not match the valid value invalid. For example, if the valid values involve numbers from 15 to 25, all the cases where the data is placed in figures are considered valid due to the strict string matching (19, 20, 25, etc.).
Fuzzy string matching involves strings that only approximately match valid values so they can be recognized. Accordingly, all the data from our example can be recognized if you use a computer program that checks how many edits are needed to make all the data uniform. If the number of such edits is small, the data expressed in numbers and words, even with some typos, is accepted with the fuzzy string-matching technique.
You can transform the text data into numbers or vice versa after matching to get a consistently formatted dataset. As you can see, fuzzy string matching is preferable because more data is preserved in the set.
How to Deal with Missing Data
When you look at your spreadsheet attentively, you will see that some cells are blank. It means that some data is missing. There are specific random and systematic causes of the missing data appearance. Random causes emerge from errors in data entry, errors caused by the lack of attention, or misunderstanding or misreading of measures. Non-random or systematic missing data appear from badly designed, unclear, confusing, or inappropriate measurement formats.
You can tackle missing data in the following ways:
- accept the data with its missing parts
- remove the cases completely
- try to restore the missing data
Normally, you do not need to do anything with random missing data, but you have to remove or replace non-random ones. However, while removing some data, you remove the participants, too, so your sample will become smaller, and your dataset may lose its statistical power.
If you opt to remove all the participants with missing data, your sample will reduce from 124 to 93 respondents.
If you do not want that to happen, you may try to apply imputation and replace the missing values with some values obtained from the reasonable evaluation. It means using different data to replace the missing one but with approximately the same value to fit the database. You need to be cautious while utilizing imputation because the replaced data can be biased or inaccurate.
What to Do with Outliers?
Outliers differ substantially from all other data points. They display extreme values, but you may never know whether they are false or true. True outliers are quite possible because they only display natural variations in the sample.
When the athlete has been training for a 100-meter Olympic sprint and then becomes a participant in your research project alongside common people who have to report their approximate running speed for a 100-meter race, the data will differ a lot from all the common ones. Though, the indices displayed by this athlete are natural for this case.
False outliers are caused by measurement errors, unrepresentative sampling, or errors in data entry. For instance, if you do not know how to read the timer or it is broken, you will get an immensely low running speed.
Outliers are easy to detect because they are always located on the opposite extreme ends of any dataset. You can use the following methods to specify them:
- check the minimum and maximum values after sorting the data from low to high or vice versa
- search for outliers in the visualized dataset from a boxplot
- identify the extreme values with the help of statistical procedures
To deal with outliers after you have detected them, you need either to retain or remove them. You can retain as many outliers as possible if they are natural. Though, you should get rid of them if they are the results of errors or measurement inconsistencies. You need to document every outlier when you remove it and explain the reasons for removal so that other researchers can follow your procedure and understand what has happened.
Final Thoughts
Now, you have a lot of information related to data cleansing importance and the best practices to make your data more valid, uniform, unique, and consistent. You can apply the methods and techniques featured in this article for your further research to increase the validity of results and conclusions.
Understanding why data cleansing is so important will help you avoid many errors and biased research results and continue your academic career with new successful research and advancements in your field of study.